If you rent a property short term, you already know the feeling: the money shows up in pieces. A payout from Airbnb on Tuesday, a deposit from VRBO the following week, a direct booking paid by check, and a cleaning invoice that lands right in the middle of it all. Ask yourself what the property actually earned last month and the honest answer is usually a shrug and a rough guess.
That guess matters more than it seems. It decides how much cushion you keep for the slow months, whether you can afford the repair you have been putting off, and - the big one - whether the short-term rental is really beating what a simple long-term lease would pay you. The recent updates to the Property page are built to replace that guess with numbers you can see.
Two Ways to Rent, Two Ways to Track
Every investment property card now has a Rental Type setting: Long-Term (Monthly Rent) or Short-Term (Airbnb/VRBO). The card adjusts to match how the property actually earns money.
- Long-term rentals keep the familiar monthly rent figure and gain a Rent Payment Tracker: a month-by-month checklist where you mark each month Paid and, if it came in after the due date, Late.
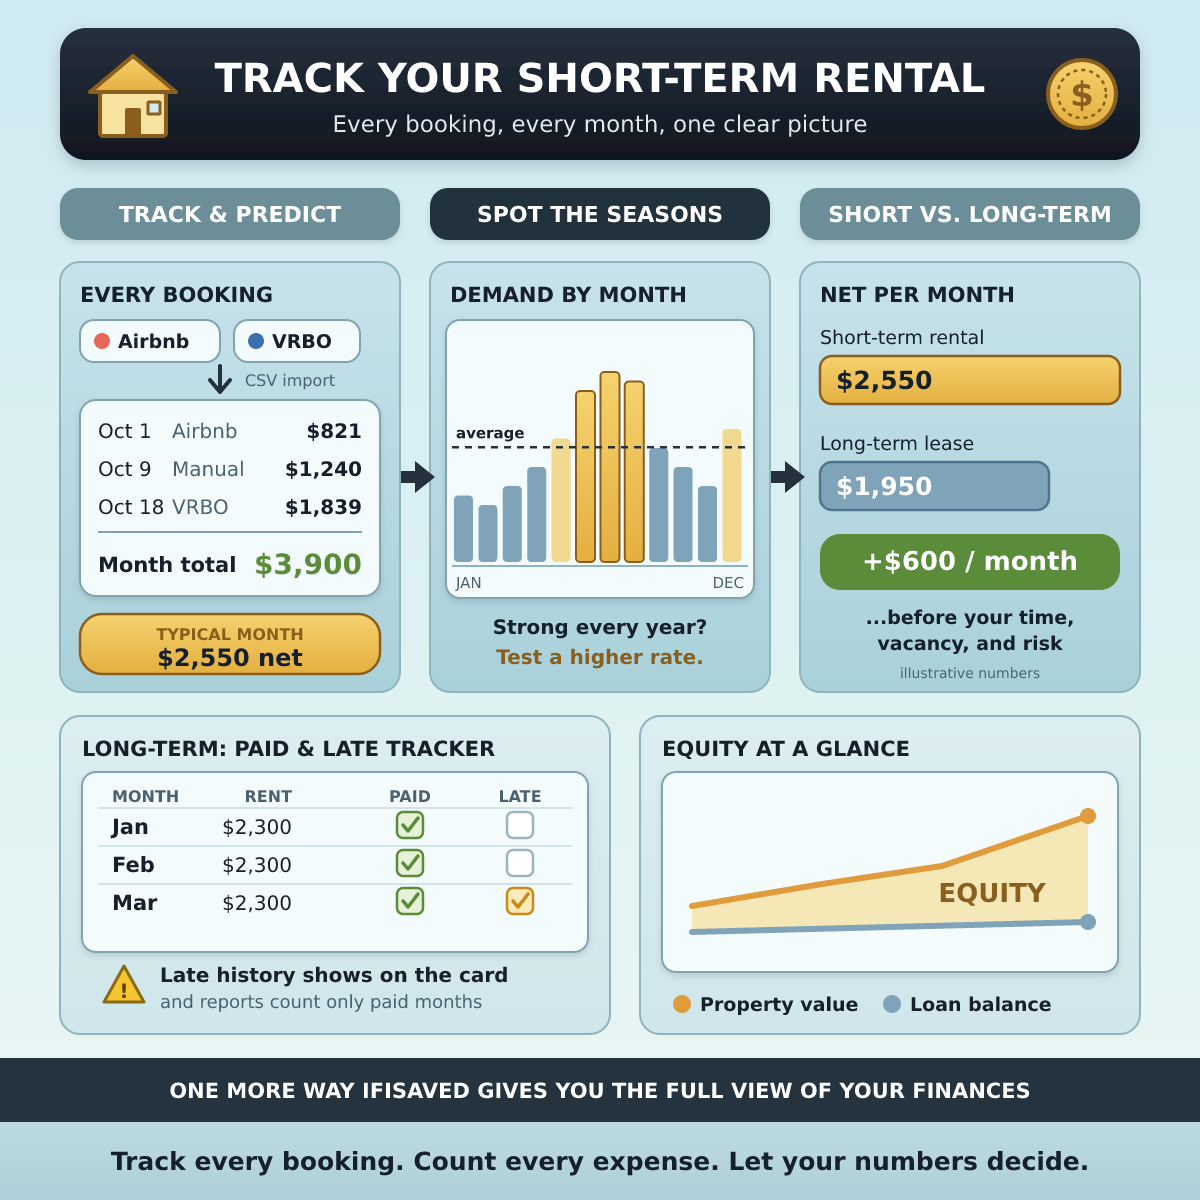
- Short-term rentals get an income ledger. Every booking is its own line - date, guest or description, source, and amount - and the month's total is simply the sum of those bookings, so you can see exactly what each stay contributed.
Getting Your Bookings In Without Retyping Them
Nobody wants to hand-enter a year of reservations. On a short-term rental card you can add a booking manually, or use Import Income to upload the payout report straight from the platform:
- Airbnb - upload the payout CSV. The importer reads the check-in date and your Net Payout, and keeps the guest name, listing, and number of nights in the description.
- VRBO - upload the Payment History report from the Owner Dashboard (Payments, then Payment history, then Download report). It uses the check-in date and the Payout column.
- Other platforms or your own spreadsheet - a plain CSV with a date column and an amount column works too.
You get a preview of the bookings and the total before anything is saved. Each booking carries its confirmation code or reservation ID, so if you upload a report that overlaps one you already imported, the existing entries are updated instead of doubled up. Expenses - cleaning, supplies, utilities, repairs - go in the same place they always have, either entered by hand or pulled from budget transactions you have flagged as rental expenses.
One detail worth knowing: income is recorded on the check-in date. A stay that begins on the 29th and ends on the 3rd counts toward the month it started. Keep that in mind when you compare months.
From a Pile of Payouts to a Number You Can Plan Around
Once the bookings are in, the card shows the month you select: short-term income, expenses, and what is left over. The Print Statement button produces a clean monthly income statement, and Print Annual Statement lays out the whole year, month by month, with a summary table of income, expenses, and net for each month.
That annual table is the foundation of a realistic forecast. The app does not guess at the future for you - it gives you your own history in a form you can actually use:
- Your typical month. Divide the year's net by twelve. That is a much better planning number than your best month.
- Your floor. Look at the weakest months. If your slowest stretch still covers the mortgage and the recurring bills, you can breathe. If it does not, that gap is the reserve you need to hold.
- Your cash-flow rhythm. If most of your income lands in a few strong months, you can set aside part of it for the lean ones instead of being surprised by them.
For a long-term rental, the same idea applies with less drama: the tracker shows the rent you are entitled to across a full year, and the reports count rent only for months you have marked Paid. What you collected is what shows up, not what you hoped for.
Reading the Seasons: When Demand Peaks and When to Raise Rates
Short-term demand is rarely flat. Summer weekends, holidays, local events, and school breaks push some months far above others. Your income history shows that pattern - it just has to be laid out side by side.
Use the year selector to pull up the annual statement for each of the last two or three years and compare the same months against each other. A few things to look for:
- Months that are strong every year. If a month has been your top earner two years running, that is a consistent demand signal, not luck. It is the strongest case for testing a higher nightly rate or a longer minimum stay.
- Months where income keeps growing. Rising income in the same month year over year usually means you are under-priced for the demand you are getting.
- Shoulder months that fall flat. Consistently weak months are candidates for discounts, longer-stay offers, or a maintenance window - projects you can schedule when the calendar is empty anyway.
Be careful not to confuse more income with more bookings. If income rose because you raised rates and bookings held steady, the price increase worked. If it rose only because of an unusually long stay, that is one data point, not a trend. The itemized bookings on each month's statement make that difference easy to spot.
Short-Term or Long-Term: Which One Actually Pays You More?
This is the question the whole exercise builds toward, and the answer is rarely as obvious as the headline income makes it look. Short-term rentals usually gross more per month, but they also cost more to run: cleaning after every stay, supplies and linens, higher utilities, platform fees, furnishing and replacement, and more wear on the property. They also come with vacancy - nights nobody booked - and with the hours you spend managing guests, or the fee you pay someone to do it.
A long-term lease usually grosses less, but the costs are lower and steadier, and you are not turning the property over every few days. The comparison that matters is net income - what is left after expenses - not what the booking platform deposits.
Here is how to run that comparison with your own numbers. The figures below are a hypothetical illustration:
- Get your short-term net. From the annual statement, take the year's income minus expenses and divide by twelve. Say your short-term rental averages $3,900 a month in payouts against $1,350 in recorded expenses. That is $2,550 net per month.
- Estimate the long-term alternative. Look at what comparable properties in your area rent for unfurnished on a 12-month lease. Say $2,300 a month, with perhaps $350 a month in the expenses you would still record, such as repairs and maintenance. That is $1,950 net per month.
- Compare the gap. In this example the short-term rental comes out ahead by $600 a month, or $7,200 a year.
- Put a price on your time and risk. If managing the rental takes you ten hours a month, that $600 is roughly $60 an hour. If it takes thirty, it is closer to $20. A soft season or a bad review streak could erase the difference; a long-term tenant who pays on time does not have that problem.
If the short-term rental wins comfortably, you have evidence to keep going and to price with confidence. If the gap is thin - or if your weakest months would leave you short - a long-term lease may deliver nearly the same money with far less work and far less variability. Either way, you are deciding with your own data instead of a hunch.
The expenses in that comparison are the ones you record on the property card. Your mortgage payment, property taxes, and insurance are usually the same under either strategy, so they mostly cancel out - but if your situation differs, adjust the numbers accordingly.
Keeping an Eye on Tenants, Too
If you do choose or keep a long-term rental, the tracker gives you something short-term hosts never get: a payment history. Marking a paid month as Late takes one click, and once any month has been marked late, a small warning triangle appears next to the property name on the card. It is a quiet reminder of the tenant's track record when you are deciding whether to renew, raise the rent, or hold it steady.
And whichever way the property is rented, the card also plots its valuation against the loan balance, so the equity you are building is visible next to the income the property produces. Cash flow and equity together tell you far more than either one alone.
How to Get Started
- Open the Property page and find your investment property.
- Set the Rental Type to Short-Term or Long-Term.
- For a short-term rental, import your last year of payout reports from Airbnb or VRBO, or add bookings by hand.
- Add the expenses you have paid for the property so the net numbers are honest.
- Print the annual statement, note your typical month and your weakest one, and compare years for seasonal patterns.
- Run the short-term versus long-term comparison above with your own figures.
The property that looks best on gross income is not always the one that pays you best. Track every booking, count every expense, and let a year of your own numbers answer the question.
This post is for educational purposes only and is not tax, legal, or financial advice. Rental income is taxable, and rules for short-term rentals vary by location, so consult a qualified professional about your situation.