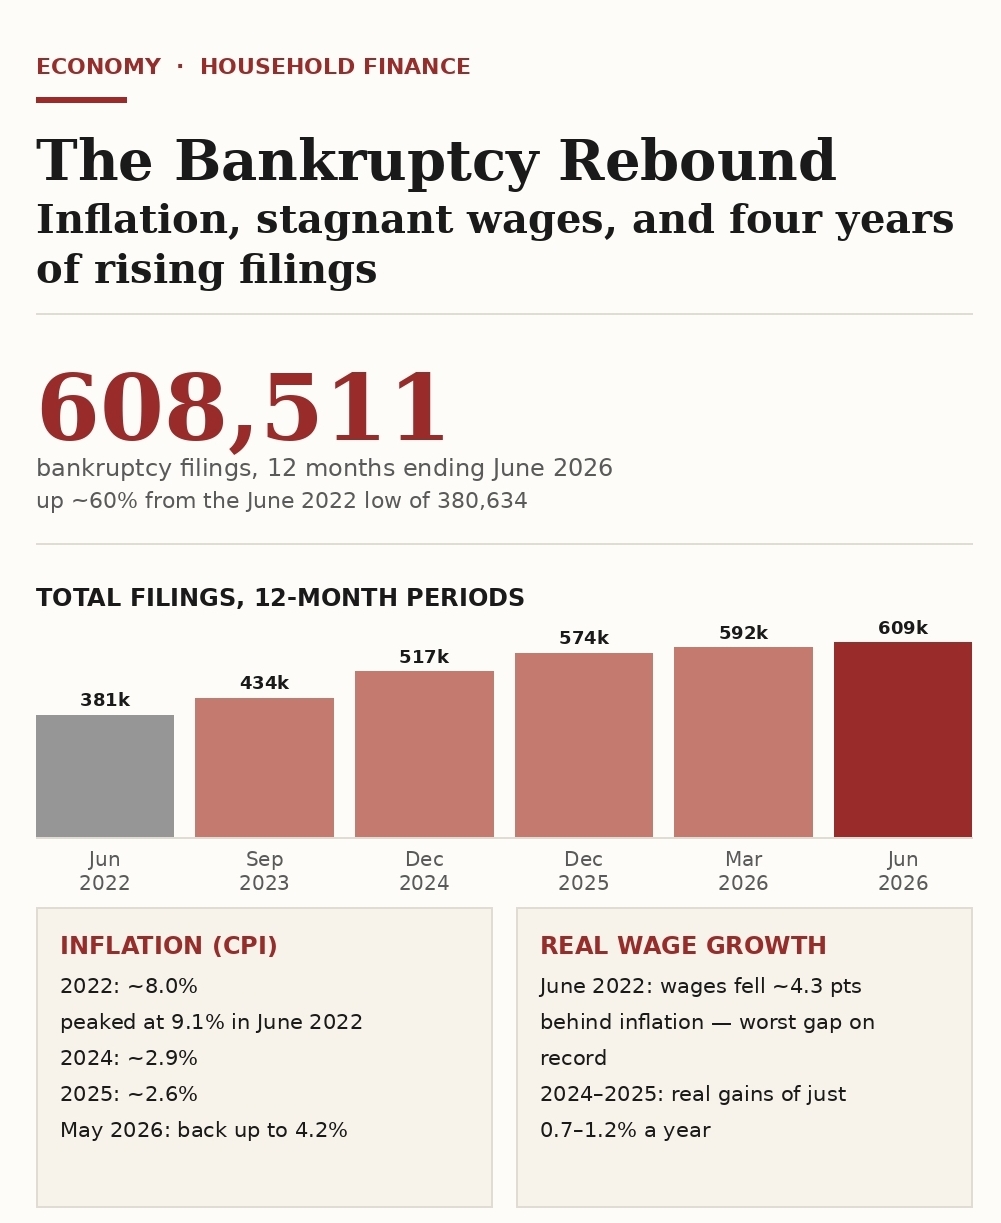
For more than a decade, one of the quieter success stories in American household finance was the steady decline in bankruptcy filings. From a post-recession peak of nearly 1.6 million cases in the year ending September 2010, total filings fell almost every year, bottoming out at just 380,634 in the twelve months ending June 2022 — a 76% collapse. Then the trend reversed. Filings have now risen for sixteen straight quarters, and the data from the U.S. Courts' bankruptcy dashboard tells a story that lines up closely with the inflation shock of 2021–2023 and the uneven wage recovery that followed.
The Numbers: A Steady Climb Since 2022
According to the Administrative Office of the U.S. Courts, total bankruptcy filings have climbed in every reporting period since the June 2022 trough:
- Year ending Sept. 2023: 433,658 filings, up 13% from 383,810 the year before
- Year ending Dec. 2025: 574,314 filings, up 11% from 517,308 in 2024
- Year ending March 2026: 591,850 filings, up 11.9% from 529,080
- Year ending June 2026: business filings jumped 16.9% (23,043 → 26,941); non-business filings rose 12% (519,486 → 581,570)
That's roughly a 60% increase in total filings in four years — a sharp reversal after a decade of decline, though still well below the 2010 peak. Notably, the most recent quarter shows business bankruptcies growing even faster than household filings, suggesting small businesses are increasingly feeling the squeeze alongside consumers.
Where This Lines Up With Inflation
The timing is hard to ignore. Annual inflation, as measured by the CPI, ran roughly as follows:
- 2021: ~4.7%
- 2022: ~8.0% (peaking at a 9.1% year-over-year rate in June 2022 — the exact month bankruptcy filings hit their low point)
- 2023: ~4.1%
- 2024: ~2.9%
- 2025: ~2.6%
- Mid-2026: inflation has reaccelerated, hitting 4.2% in May 2026 — the highest since April 2023 — driven largely by an energy price shock and tariff-related cost increases
The bankruptcy trough and the inflation peak happening in the same month is a striking coincidence, but it also makes intuitive sense: households were still cushioned by pandemic-era savings and stimulus in mid-2022, even as prices were rising the fastest. What we're seeing since then looks like a delayed reaction — the bankruptcy increase isn't concurrent with peak inflation, it's a lagging consequence of it. Savings cushions built up in 2020–2021 got drawn down, credit card balances (which have since climbed past $1.2 trillion nationally) absorbed the gap between rising costs and stagnant paychecks, and now those balances are coming due.
The Wage Side of the Story
This is where the wage data fills in the picture. During the worst of the inflation surge, real (inflation-adjusted) wages went backward. In June 2022, nominal wages grew 4.8% year-over-year while inflation ran at 9.1% — a nearly 4.3 percentage-point real pay cut for the average worker, the widest gap on record in over a decade of BLS data. That single fact does a lot of explanatory work: workers weren't just facing higher prices, their paychecks were actively losing ground to those prices at the exact moment the cost of living jumped.
Real wages have recovered since — but only modestly, and unevenly:
- Real average hourly earnings rose about 0.7–1.2% annually in 2024 and 2025
- By June 2026, nominal wages (3.8%) were only barely outpacing inflation (3.5%) — a real gain of just 0.29 percentage points
- Gains have been concentrated unevenly: workers in the bottom half of the wage distribution are still, in some cases, below where pre-pandemic wage trends would have put them
In other words, the "recovery" in purchasing power has been thin and fragile, not a robust rebound. A few years of prices growing faster than paychecks, followed by a few years of paychecks barely keeping pace, doesn't undo the damage — it just stops it from getting worse. For a household that leaned on credit cards to bridge the gap in 2022, a wage gain of half a percentage point a year isn't enough to dig back out, especially with student loan repayments having resumed and medical costs continuing to climb faster than overall inflation.
Reading the Trend Line
Put together, the pattern looks less like a single inflation "shock" and more like a slow-moving financial hangover:
- 2021–2022: Prices spike, wages fall behind in real terms, but stimulus savings and low debt levels delay the fallout — bankruptcy filings hit historic lows.
- 2023–2025: Inflation cools, wages inch ahead of prices, but savings cushions are gone and debt loads built during the high-inflation years start coming due — bankruptcy filings climb steadily, quarter after quarter.
- 2026: Just as filings approach 600,000 annually, inflation is reaccelerating (largely due to tariffs and an energy shock), which risks repeating the cycle before households have fully recovered from the last one.
Even after four years of increases, total filings remain far lower than the historical highs of the 2008–2010 financial crisis era — but the consistency of the climb, every single quarter since mid-2022, suggests the 2021–2023 inflation spike is still working its way through the economy.