"Can I afford to retire?" is really two questions: how much income do I need, and how much money does it take to produce that income for the rest of my life? The most famous attempt to answer the second question is the 4% rule. It is simple enough to do on the back of an envelope, it has been argued about for three decades, and it has held up better than most of its critics predicted. Here is where it came from, the data that supports it, how to use it, and why it is a starting point rather than a finish line.
Where the 4% Rule Came From
In 1994, a California financial planner named William Bengen published a paper in the Journal of Financial Planning called "Determining Withdrawal Rates Using Historical Data." Planners at the time often assumed a portfolio earning 7% or 8% on average could safely pay out 7% or 8% a year. Bengen suspected that averages were hiding the real danger, so he did something simple: he took actual market history and tested it.
He asked what would have happened to a retiree who:
- Held a portfolio split roughly 50/50 between large U.S. stocks and intermediate-term government bonds.
- Withdrew a fixed percentage of the starting balance in the first year of retirement.
- Increased that dollar amount every year with inflation, no matter what the market did.
- Needed the money to last 30 years.
Bengen ran this for every possible retirement start date going back to 1926. The result was the rule's famous number. Even the worst starting dates in his data (retirees from the late 1960s, who faced inflation and weak markets back to back) could have taken a first-year withdrawal of a little over 4% of their starting portfolio, raised it with inflation each year, and still had money after 30 years. Most retirees in the data could have taken considerably more. He rounded the worst case to 4%, and the 4% rule was born.
In 1998, three professors at Trinity University (Cooley, Hubbard, and Walz) published a similar study, now called the "Trinity Study," that looked at different stock and bond mixes and reached much the same conclusion. Together, the two studies are the foundation of most retirement withdrawal guidance written since.
The Historical Data: Why It Works
We wanted to see it for ourselves, so we rebuilt the test using publicly available data: annual total returns for the S&P 500 (dividends included) and 10-year U.S. Treasury bonds from Professor Aswath Damodaran's historical returns dataset, and annual inflation (CPI) from the Federal Reserve. We tested a $1,000,000 portfolio, 50% stocks and 50% bonds, rebalanced yearly, withdrawing 4% ($40,000) in year one and raising it with inflation. Every year from 1928 through 1996 is a possible retirement start date with a full 30 years of history behind it, giving us 69 different retirements.
Note that our version uses 10-year Treasuries and a different data source than Bengen did, so the exact numbers differ from his. The shape of the result is the same.
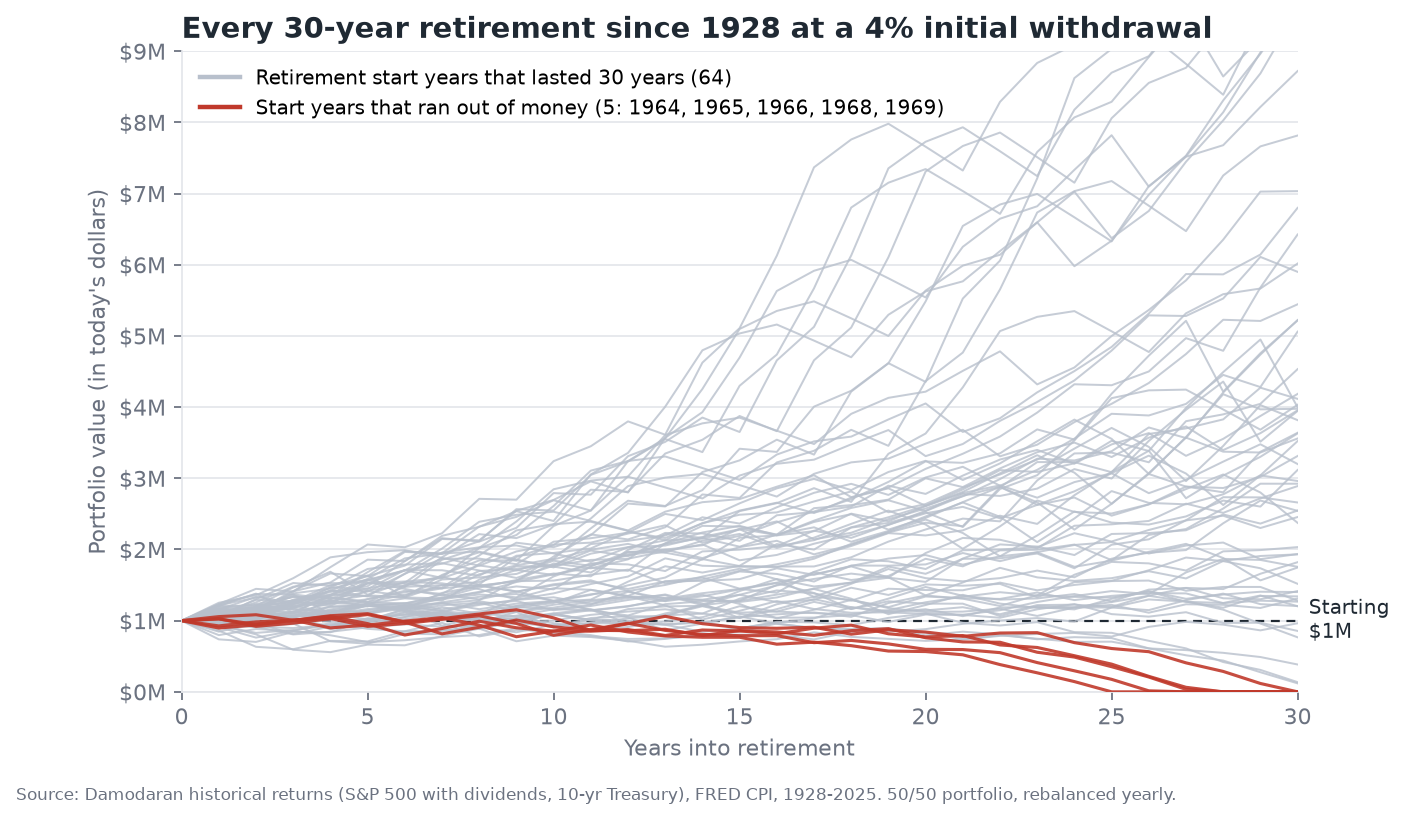
Each line is one retirement. Most grew well beyond the starting balance despite the withdrawals. The five red lines are the retirements that began in 1964, 1965, 1966, 1968, and 1969.
Two things stand out. First, the large majority of retirees finished far ahead. Even after 30 years of withdrawals that rose with inflation, 58 of the 69 retirements ended with more than they started with, in today's dollars. Second, the few failures are clustered together. They all began in the mid-to-late 1960s, just before the stagflation of the 1970s, when stocks went nowhere for years while inflation pushed the withdrawals up. That is called sequence-of-returns risk: bad returns early in retirement hurt far more than the same bad returns later, because you are selling shares while prices are low and they never get the chance to recover.
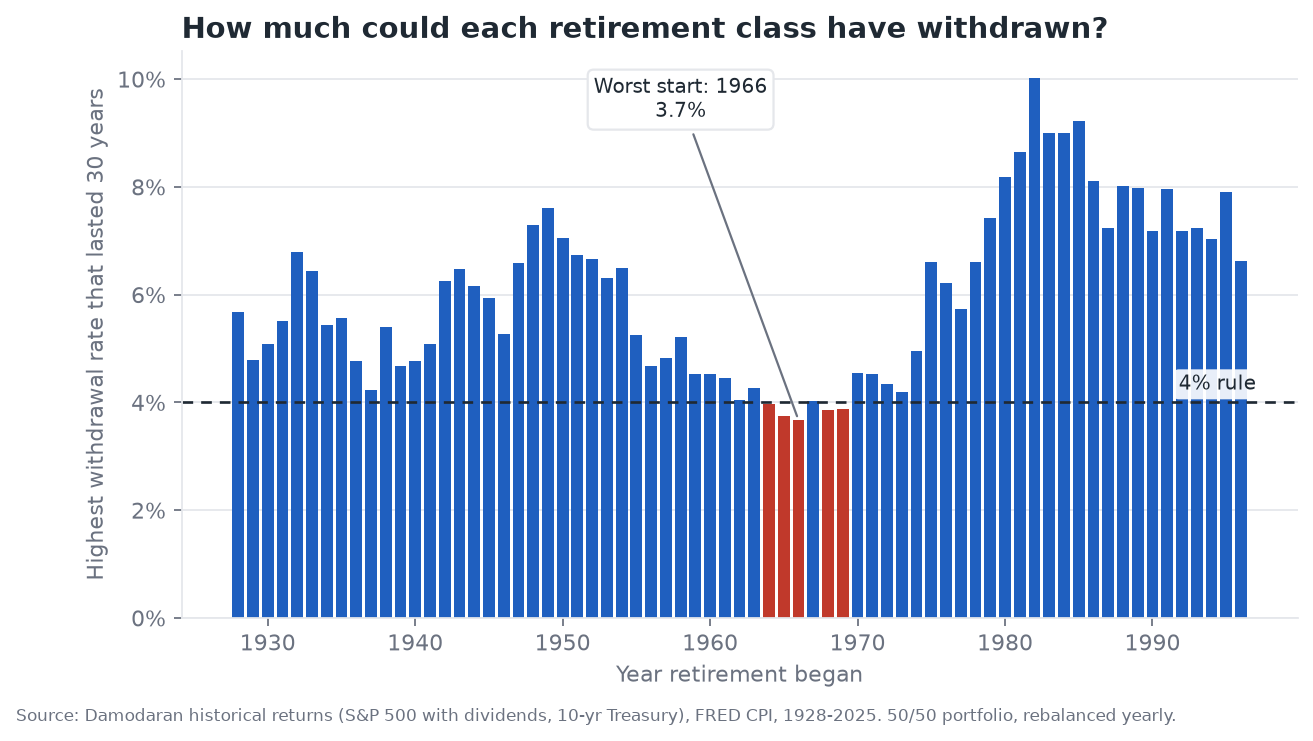
For each starting year, this is the highest first-year withdrawal rate that would have lasted 30 years. The dashed line is 4%. Only the mid-1960s starts fall below it, and the worst case (1966 in our data) was about 3.7%.
The typical retirement could have supported a much higher withdrawal. In our data the middle of the pack could have withdrawn close to 6% in the first year. The 4% rule is not a prediction of what you will need; it is the floor that would have survived the worst conditions in American market history.
How to Use the 4% Rule
- Pick your retirement-day portfolio. Add up your investable accounts: 401(k), IRA, Roth, brokerage, and so on.
- Multiply by 4%. That is your first-year withdrawal. A $1,000,000 portfolio gives $40,000.
- Raise it with inflation each year. You do not recalculate 4% of the new balance. You take last year's dollar amount and add that year's inflation. At 2.5% inflation, $40,000 becomes about $41,000 in year two.
- Subtract your guaranteed income when you plan. Social Security, a pension, and rental income reduce what the portfolio needs to cover. If you spend $60,000 a year and Social Security pays $30,000, your portfolio only has to produce $30,000, which a 4% rule portfolio does with $750,000.
A quick reference for the first year:
| Portfolio at retirement | Year-1 income at 4% | Per month |
|---|---|---|
| $500,000 | $20,000 | $1,667 |
| $750,000 | $30,000 | $2,500 |
| $1,000,000 | $40,000 | $3,333 |
| $1,500,000 | $60,000 | $5,000 |
| $2,000,000 | $80,000 | $6,667 |
What It Means for Your Income
The income starts at 4% and then keeps its purchasing power. That is the whole point: the first-year $40,000 is meant to buy the same lifestyle in year 30 that it bought in year one. In nominal dollars, that means your paycheck from the portfolio keeps climbing. At 2.5% inflation, a $40,000 first-year withdrawal grows to about $82,000 by year 30. At 3% inflation it grows to about $94,000. If those numbers surprise you, it is a good reminder of what inflation does over three decades, and why we plan in inflation-adjusted dollars.
How Much Could You Be Left With?
Here is the part that surprises people. If you followed the rule strictly for the full 30 years and never touched the plan, the typical outcome was not a portfolio that was barely alive. It was a portfolio that was much larger than the one you started with.
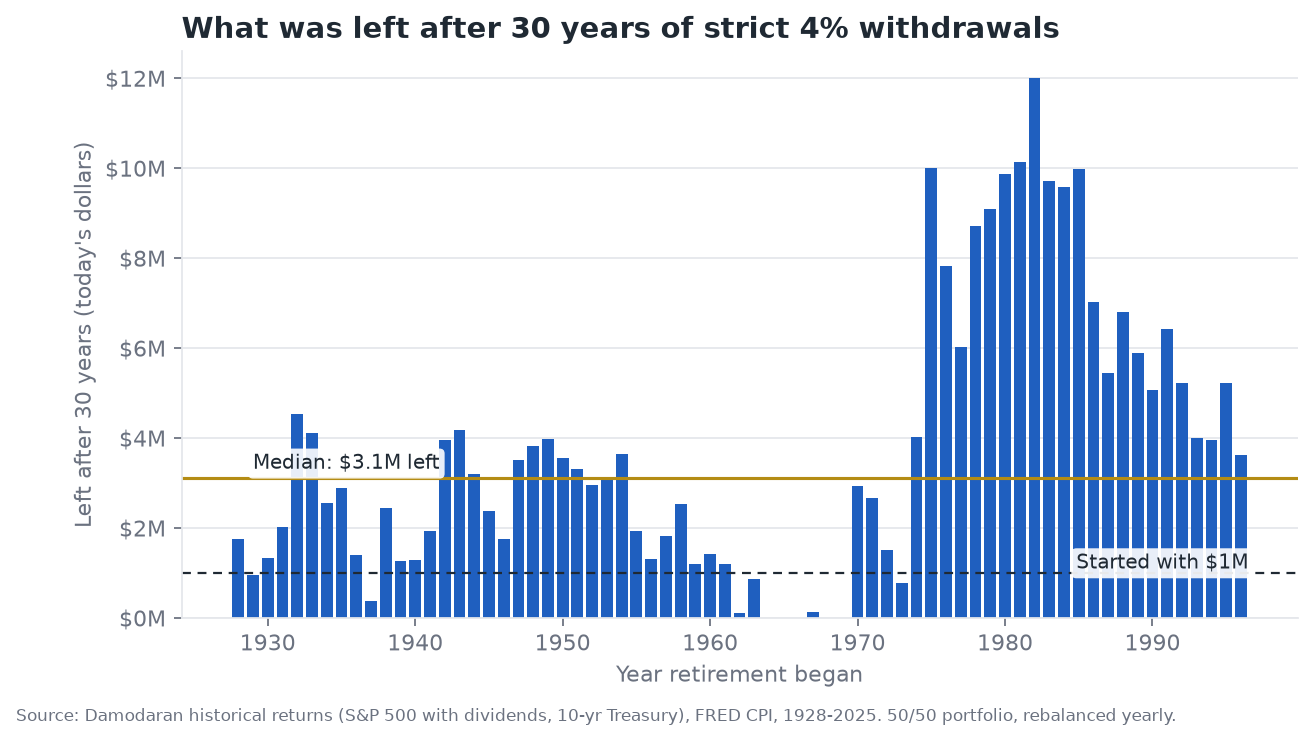
Balance remaining after 30 years of strict 4% withdrawals, shown in today's dollars, for each starting year. The gold line is the median.
Across the 69 retirements in our back-test, starting with $1,000,000 and measured in the dollars of the day you retired:
- Median: about $3.1 million left after 30 years.
- Middle half of outcomes: roughly $1.4 million to $5.2 million.
- 58 of 69 retirements ended with more than the original $1,000,000, and 44 of 69 ended with more than double.
- 5 of 69 ran out of money before year 30, all of them retirements that began between 1964 and 1969.
That is the trade-off hidden in the rule. It was designed to survive the worst case, so in most cases it leaves a large surplus. A retiree who follows it faithfully is often, in effect, saving money they will not live long enough to spend.
The Rule Has Since Been Revised Upward
Bengen himself did not stop at 4%. As he refined the research (adding small-cap stocks, a broader mix of asset classes, and more careful modeling), his safe withdrawal estimate rose. By the mid-2000s he was talking about roughly 4.5%, and in recent years he has suggested figures closer to 4.7% for a well-diversified portfolio. The back-test above shows why higher numbers are reasonable: the odds fall as the rate rises, but they do not collapse.
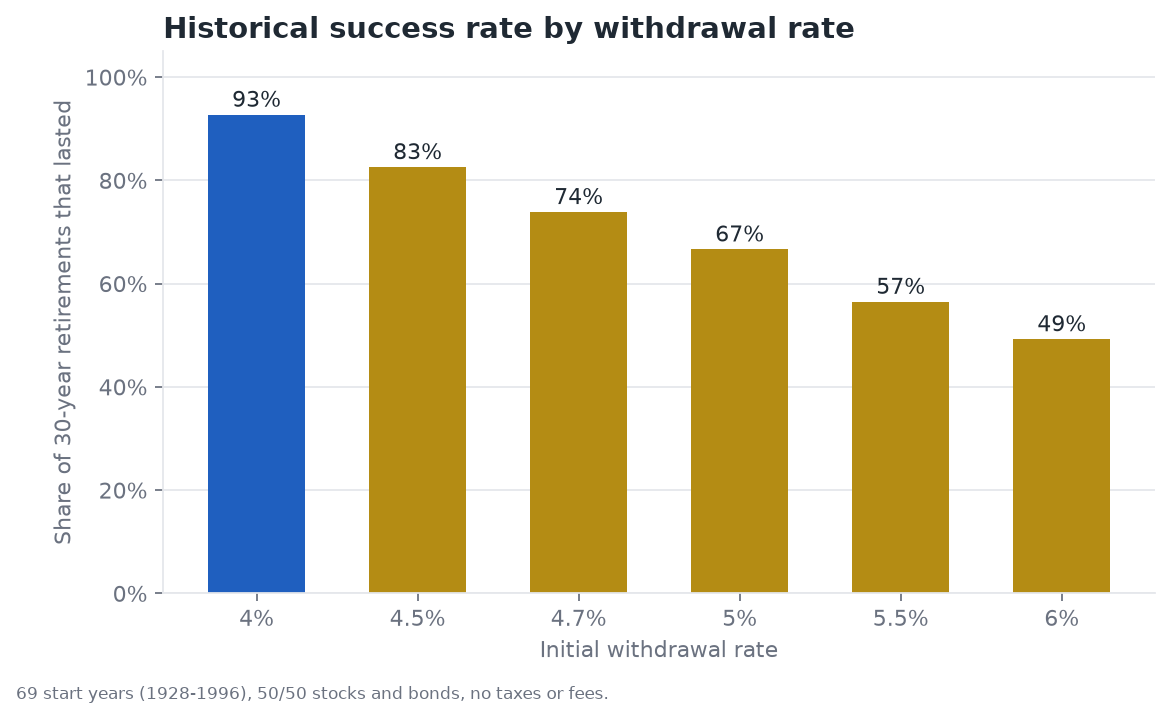
The share of historical 30-year retirements that lasted at each withdrawal rate, using the same 50/50 portfolio.
A few important points about the table behind that chart:
- At 4%, 64 of 69 starting years lasted (93%), and the failures were narrowly missed.
- At 4.5% and 4.7%, the history still supports it in roughly four of every five or three of every four starting years.
- These are all strict versions of the rule: the retiree never changes their spending, no matter what happens. Real retirees adjust. If the market falls 30% in your second year, you can skip the vacation, delay a purchase, or trim spending for a couple of years. That flexibility is worth a lot of percentage points, which is why many planners today are comfortable with starting rates above 4%.
None of this makes a higher rate risk-free. It is a judgment call about how much uncertainty you are comfortable with. If the income a 4% (or 4.5%) withdrawal produces covers the life you want, retirement may be closer than you think. The rule is there to take the fear out of the question: you do not need to guess whether you can afford to retire; you can measure it.
How Your Monte Carlo Analysis Relates to the 4% Rule
The 4% rule asks, "What would have happened in the past?" That is powerful, but history only gives us a limited number of examples. The 69 retirements above are not 69 independent experiments. They overlap, so in practice they amount to just a few distinct market eras. The future will not necessarily match any of them.
That is the gap the Monte Carlo analysis on the IfISaved Retirement Planning page is designed to fill. It asks the same basic question as Bengen's study (does the money last through every kind of market?) but tests it much more broadly. Here is how it is built:
- 1,000 simulated lifetimes. Instead of 69 historical starts, the simulation runs 1,000 different retirements from your current age to your life expectancy.
- Randomized returns each year. Each year's market return is drawn from a bell-curve distribution around the average return you choose (5% a year in retirement by default), with volatility that reflects stocks (about 12% a year in retirement). Some simulated years are great, some are terrible, and the bad years sometimes come first, which is the sequence risk that created the 1960s failures.
- Withdrawals that rise with inflation. Your expenses are raised every year at the inflation rate you set, the same mechanic Bengen used.
- Your actual situation. This is where it goes beyond the rule of thumb. It uses your account balances (traditional, Roth, HSA, brokerage, cash, and more), Social Security, pensions, rental income, part-time income, required minimum distributions, one-time expenses and windfalls, and optional Roth conversions.
- A success rate. The percentage of the 1,000 lifetimes that still had money at your life expectancy is your success rate, the Monte Carlo equivalent of the 69-retirement scorecard above. You also see the range of ending balances (10th, 25th, 50th, 75th and 90th percentiles), the same kind of spread you saw in the chart of leftover balances.
The two approaches are complementary. The 4% rule is built on what did happen and the Monte Carlo is built on what could happen, with returns drawn from realistic averages and volatility. When the two agree, you can be more confident. When your Monte Carlo result is lower than the rule of thumb suggests, it is usually because it knows something the rule does not, such as a long retirement, high expenses relative to your guaranteed income, or most of your money in tax-deferred accounts.
The default assumptions are deliberately conservative: a 5% average return in retirement is below what a 50/50 portfolio has historically earned. You can change the return assumptions for each account to see how sensitive your plan is.
See Your Own Numbers
The best way to test the 4% rule is to apply it to your life. Open the Retirement Planning page and look at the Monte Carlo analysis. It will use your accounts and your Social Security estimate, show your chance of success, and let you try different retirement ages, spending levels, and return assumptions. Try raising your retirement spending to a 4.5% withdrawal and see what happens, or add a one-time expense to see how much it changes the outcome. You can learn more about how it works on the retirement planner feature page.
The Bottom Line
- The 4% rule came from William Bengen's 1994 research on real market history: a first-year withdrawal of 4%, raised for inflation, survived every 30-year retirement in his data, including the worst ones.
- In our own back-test, 4% lasted in 64 of 69 starting years, and the median retiree finished with roughly three times the starting balance, adjusted for inflation.
- Bengen and others have since raised the safe rate toward 4.5% to 4.7% as the research improved, and flexible spending can support higher rates still.
- If the income your portfolio produces at 4% to 4.7%, plus Social Security and other income, covers the life you want, you can feel good about retiring.
- Use the Monte Carlo analysis to see how your specific situation holds up, rather than relying on a single rule of thumb.
This post is for educational purposes only and is not financial, tax, or investment advice. Past performance does not guarantee future results. The back-test described here uses annual returns, a 50/50 stock and bond portfolio, and does not include taxes, fees, or changes to spending. Your results will differ.